As droughts become more common and severe, understanding how to track and interpret drought conditions is crucial for homeowners, particularly those relying on well water. Wells can run dry due to drought, but understanding drought maps is a powerful prevention tool. Drought maps offer a clear view of areas facing water shortages, from moderate droughts to severe, long-term conditions. By reading these maps, homeowners can predict when water shortages might affect their wells and take action before it’s too late, giving them a sense of control and empowerment.
Drought maps explain why wells dry during droughts and provide essential data for effectively managing well water. With this knowledge, homeowners can ensure their wells continue to perform even during severe drought conditions.
What Are Drought Maps?
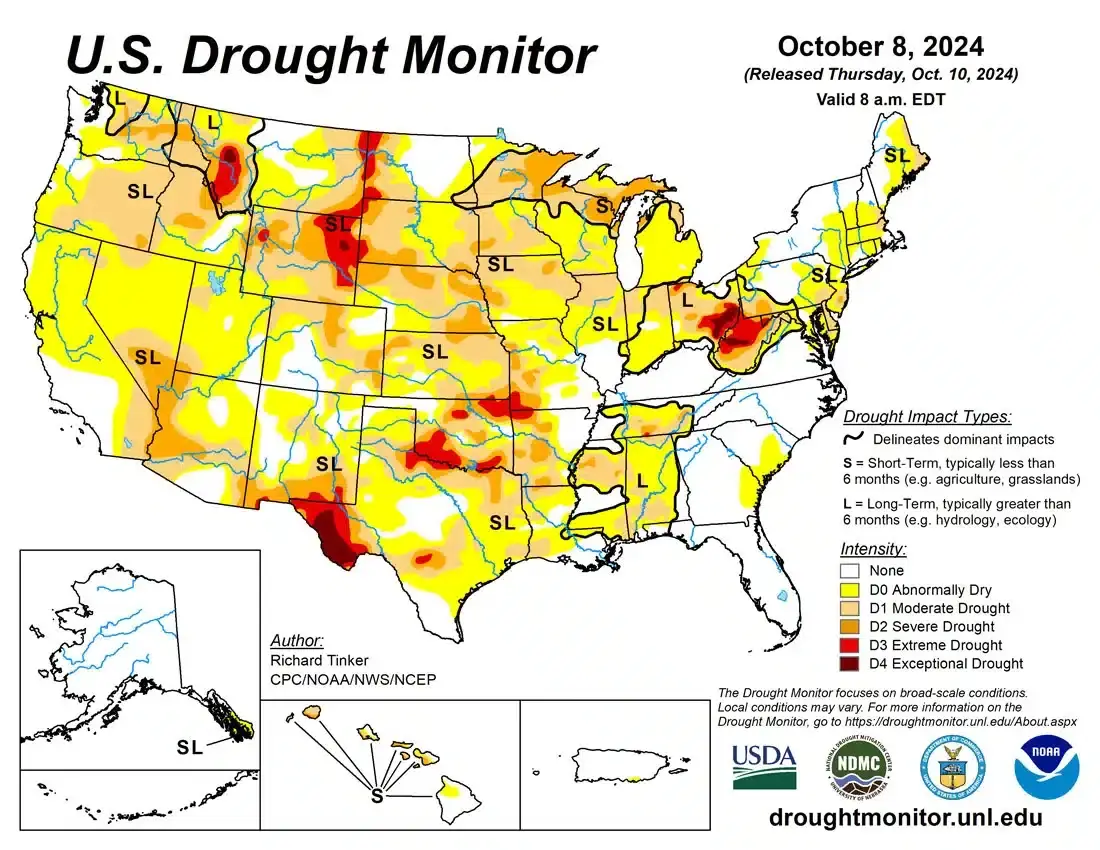
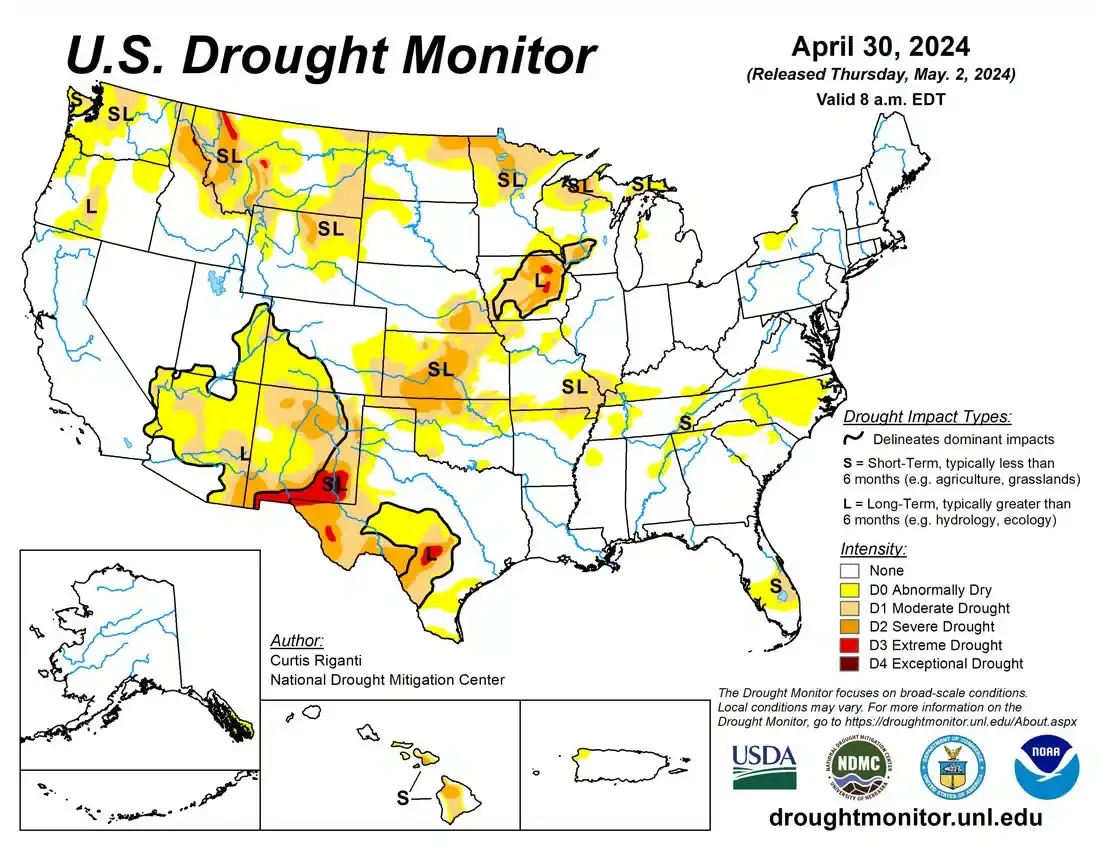
Drought maps, such as those produced by the U.S. Drought Monitor (USDM), visually represent areas experiencing drought across the United States. These maps categorize regions based on the intensity of the drought, ranging from “Abnormally Dry” (D0) to “Exceptional Drought” (D4), which represents the most severe conditions. The darker the color on the map, the more intense the drought.
The USDM produces weekly updates that track how drought conditions change. The maps are created by analyzing various data inputs, including precipitation, soil moisture, and streamflow levels. For homeowners relying on well water, these data points directly correlate to why their wells may experience reduced water yield or dry out.
How to Read a Drought Map
Drought maps are color-coded to represent different drought levels, and learning to read these maps can help explain why certain wells lose water. Here’s a breakdown of the categories:
- D0 – Abnormally Dry:Yellow areas on the map indicate regions either coming out of drought or slipping into one. Wells in these areas may show the first signs of reduced yield.
- D1 – Moderate Drought:Light brown areas represent regions where water shortages begin to develop, potentially affecting agricultural production and home water supplies. Wells may experience early signs of pressure drops due to declining groundwater.
- D2 – Severe Drought:Darker brown areas indicate common water shortages. This is where many wells begin to dry up as groundwater levels drop significantly, making it harder for wells to replenish.
- D3 – Extreme Drought:Red areas show significant water shortages, which have had major impacts on crops, livestock, and household water supplies. Wells in these areas may struggle to provide water, especially during peak usage.
- D4 – Exceptional Drought:Dark red areas reflect the most severe droughts, often resulting in widespread water shortages, failed crops, and severe ecosystem damage. In these regions, wells will likely run dry.
By understanding these categories, homeowners can anticipate how their wells might be affected as drought conditions progress.
Why Drought Maps are Important for Well Water Management
Drought maps are vital for planning and preparedness, especially for homeowners who rely on well water. Knowing the current drought status in your area helps explain why your well might be running dry and allows you to take preventive measures. For example, if you live in a D2 or higher region (severe drought or worse), groundwater levels are likely dropping, making it harder for your well to provide sufficient water.
This is where Well Manager comes in. Well Manager’s systems are designed to optimize water usage from wells, even in low-yield situations. By storing water from the well and maintaining adequate pressure, Well Manager ensures your household can continue to rely on its well, even during times of drought. Understanding drought maps lets you know when and how to implement these solutions to prevent water shortages, providing confidence and reassurance.
How to Use Drought Maps to Protect Your Well
Drought maps provide essential information for managing homeowners’ water supplies, particularly those with wells. If your region is classified as D2 or higher, you should prepare for potential water shortages. Well Manager solutions, such as water storage systems and water pressure boosters, can help maintain a consistent supply, even when groundwater levels are low.
Understanding the data behind drought maps helps explain why some wells dry up while others maintain a steady flow. Wells in regions marked by D3 or D4 conditions will likely experience severe water shortages as the soil moisture and groundwater depleted significantly. However, a system like Well Manager allows you to store and ration water, ensuring your household’s needs are met even during extreme drought conditions.
Why Understanding Drought Maps Can Save Your Well
By staying informed about drought conditions through reliable maps, homeowners can better understand why their wells might be drying up and take steps to prevent this. Drought maps aren’t just for experts—they provide valuable insights for anyone looking to protect their water supply. By learning to read and interpret these maps, homeowners can plan, install necessary water management systems like Well Manager, and ensure their wells never run dry.
Don’t wait until you’re well is struggling to keep up. Use drought maps to stay ahead of water shortages and ensure your home’s water supply remains stable, no matter how severe the drought.
Where to Find Drought Maps
Several trusted sources provide up-to-date drought maps.
- S. Drought Monitor (USDM):The primary source for weekly drought conditions across the U.S. These maps are available online and are updated every Thursday. The USDM uses climate data, soil conditions, and expert analysis to create reliable, up-to-date maps.
- NOAA’s Drought Portal (Drought.gov):This site offers interactive maps and detailed reports on drought conditions, including specific impacts on water supply, agriculture, and communities. Users can search by location to get detailed reports for their area.
- National Integrated Drought Information System (NIDIS):NIDIS provides real-time drought information, including forecasts and historical data. The site also offers tools to help you understand how drought affects different sectors, such as agriculture or water management.
Related Reading
- Who Used All the Water?!?!—Understanding Your Well Recovery Rate
- Understanding Low Yield Wells: A Crucial Aspect of Water Resource Management
- How to Survive a Drought with a Low Yield Well
- Why Traditional Low-Yield Well Solutions Fall Short: Discover a Better Alternative
- Understanding the Symptoms of a Low-Yield Well


